Methods
Fire scars on trees were sampled intensively on three study areas in different parts of the Bitterroot National Forest (fig. 1). Each of these areas includes similar patterns of forest types extending over a broad elevational range (from about 4,000 to 8,000 feet) on a variety of exposures. The three study areas include terrain, forest types, and presumably fire histories that are representative of the 1.2-million-acre Montana portion of the Bitterroot National Forest.

Figure 1.—Location of the three study areas.
Sampling and analysis techniques were developed on the Onehorse Study Area, and are explained in greater detail in Arno (footnote 1). (A "how-to-do-it" report for determining fire history based on these procedures is in preparation, by Arno and K. Sneck.) The Tolan and West Fork Study Areas were selected to provide a broader geographical basis for interpreting the role of fire in the Bitterroot National Forest. These latter sites were chosen in part because fuel-inventory studies were also being conducted there as part of the Fire in Multiple Use Management Research, Development, and Application Program (USDA Forest Service 1975). Each of the study areas was also chosen to sample unlogged forest at all elevations on a variety of aspects, and to record fire history in the form of fire scars on living trees and fire-initiated age classes of shade-intolerant conifers.
Initially, reconnaissance transects were made along roads, trails, and cross-country routes into all major portions of each study area. An attempt was made to visit representative aspects and elevations and not to over-sample narrow, ridgeline ecotones where vegetative types and fire patterns converge. Three types of information were gathered along each transect:
1. Habitat types, identified and mapped according to the Pfister and others (in press) classification.
2. Seral stand types were described and periodically sampled, including increment boring 1 foot above ground level to identify all age classes of shade-intolerant trees. (Corings were counted in the lab.)
3. Fire-scarred sample trees, located and described in terms of number of individual scars and tree soundness (lack of decay).
After the initial reconnaissance, trees in each stand with the largest number of relatively sound fire scars were chosen for sampling. A roller-tipped chain saw was used on large trees to take a cross section of only the wood adjacent to the fire-scar wound. This "partial cross section" resulted in removal of about 10 percent of the basal area of a given large tree. Small or exceptionally rotten trees were felled. Cross sections were sanded, and rings were counted and verified with a binocular microscope (7 to 25 power) to determine the year of each fire scar.
Fire-scar sequences on individual trees were correlated with those from nearby sample trees to obtain a master fire chronology for determining actual fire years. Master chronology years should normally be within ±1 year of the actual fire except for records 250 or more years old, where accuracy diminishes. A sample of several trees is necessary to document the entire sequence of fires in one location, because individual fires often do not inflict a new wound on previously scarred trees (Arno, footnote 1).
The vertical bars in figure 2 show the number of sample trees scarred during each fire year in each of the three study areas. It is evident from the dashed line that sample size diminishes prior to the mid-1700's. This probably accounts for any "apparent" decrease in the fires prior to 1750. In contrast, despite a large sample size, fires diminished in the 1900's. Presumably, this decreasing fire occurrence partially reflects the role of organized fire suppression. Therefore, the interval 1735 to 1900 was considered to provide the best data base for analyzing fire frequencies in the era prior to fire suppression (Arno, footnote 1).

Figure 2.—Forest fire chronologies for the three study areas on the Bitterroot N. F., Montana, showing the number of sample trees scarred each fire-year. Dashed lines indicate the number of fire-susceptible trees (i.e., trees already scarred at least once) in the sample.
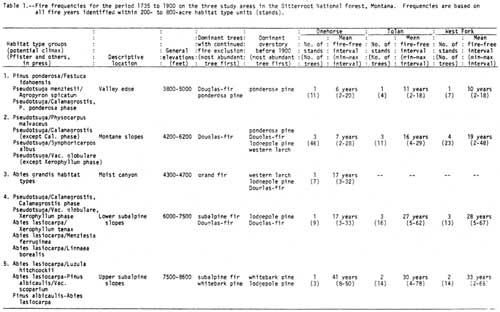
To correlate an adequate number of individual tree records for a given area, it was necessary to calculate fire frequencies for stands of 200 to 800 acres. The boundaries were drawn so that each stand represented only one category of habitat types. The fire record for each stand was thus determined by correlating the individual chronologies from the several sample trees within it. Consequently, the fire frequencies generated in this study (table 1) represent the average intervals between fires detected in a given stand. On one hand it might be argued that these intervals are actually shorter than would be expected for a given smaller stand because some of the fires detected did not cover the entire 200- to 800-acre unit. However, this effect is counterbalanced by the probability that many small or low-intensity fires were not detected in a given stand by the scarred-tree sampling. All evidence considered, these data should give a reasonable approximation of the incidence of fire in a given stand. Frequencies were averaged for all stands in a given habitat-type group in each study area. These habitat-type groups (table 1, columns 1 and 2) serve as a basis for comparison of fire frequencies within as well as among the study areas.
Table 1.—Fire frequencies for the period 1735 to 1900 on the three study areas in the Bitterroot National Forest, Montana. Frequencies are based on all fire years identified within 200- to 800-acre habitat type units (stands).
(click on image for a PDF version)